
This post will go over some of the functionality of the gtrendsR package and showing a quick workflow of how to go from keyword to plot.
library(dplyr)
library(magrittr)
library(gtrendsR)
library(knitr)
library(ggplot2)
library(patchwork)
The basics
The function gtrendsR::gtrends() is how you are able to access the google trends data. There are three elements needed to feed into this function:
- the word or phrase of interest:
keyword - the region of interest:
geo - the time period of interest:
time
Keyword
Just enter the search term of interest in quotes. To search multiple terms, add as a character vector like so: keyword=c("term 1","term 2").
Region of interest
Enter the code corresponding to the region of interest. For example, to look at Canada, you would input geo="CA". To search the province of Ontario within Canada, you would input geo="CA-ON". You can compare multiple regions in a similar way to comparing multiple keywords: geo=c("CA-ON","CA-BC").
Heres a list of the codes for Canada and it’s provinces/territories. For the full list you can run the function data(countries) after loading the gtrendsR package.
| Name | GEO code |
|---|---|
| CANADA | CA |
| ALBERTA | CA-AB |
| BRITISH COLUMBIA (COLOMBIE-BRITANNIQUE) | CA-BC |
| MANITOBA | CA-MB |
| NEW BRUNSWICK (NOUVEAU-BRUNSWICK) | CA-NB |
| NEWFOUNDLAND AND LABRADOR (TERRE-NEUVE) | CA-NL |
| NOVA SCOTIA (NOUVELLE-ECOSSE) | CA-NS |
| ONTARIO | CA-ON |
| PRINCE EDWARD ISLAND (ILE-DU-PRINCE-EDOUARD) | CA-PE |
| QUEBEC (QUEBEC) | CA-QC |
| SASKATCHEWAN | CA-SK |
| NORTHWEST TERRITORIES (TERRITOIRES DU NORD-OUEST) | CA-NT |
| NUNAVUT | CA-NU |
| YUKON TERRITORY (TERITOIRE DU YUKON) | CA-YT |
Time
Here is where you pick the time period of interest.
| Code | Time.range |
|---|---|
| now 1-H | Last hour |
| now 4-H | Last four hours |
| now 1-d | Last day |
| now 7-d | Last seven days |
| today 1-m | Past 30 days |
| today 3-m | Past 90 days |
| today 12-m | Past 12 months |
| today+5-y | Last five years (default) |
| all | Since the beginning of Google Trends (2004) |
| Y-m-d Y-m-d | Time span between two dates (ex.: “2010-01-01 2010-04-03”) |
Example
Heres an example looking at comparing the search popularity of “skiing” and “swimming” across Canada in the past year.
search1<-gtrends(c("skiing","swimming"), time= "today 12-m", geo = "CA")
plot(search1)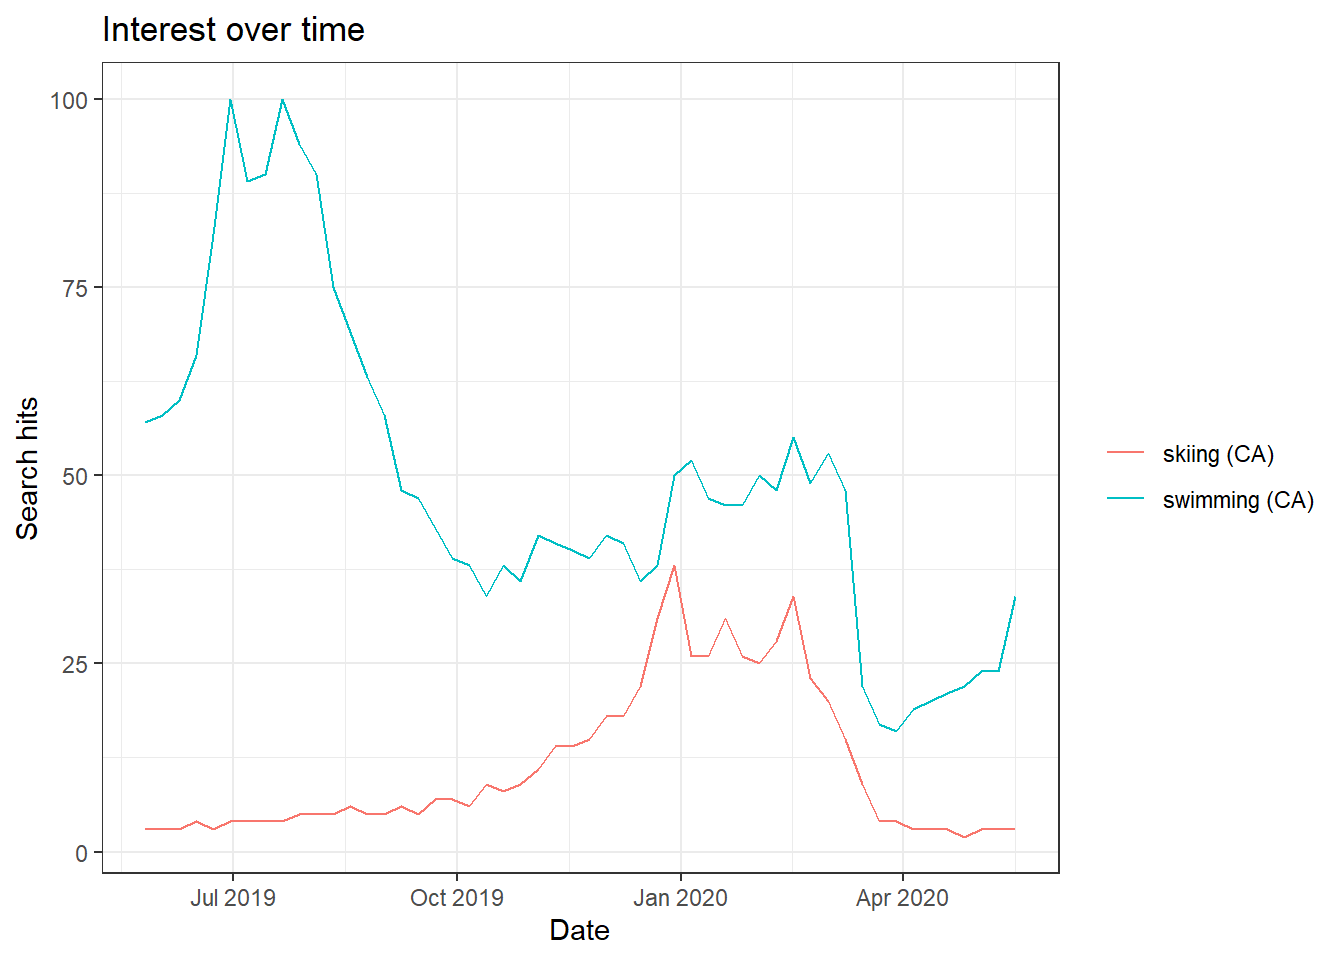
Note that the y axis does not show the raw volume of searches, but just shows relative popularity with the max value scaled to 100.
Advanced settings
Manually plotting
For those that want more control over the plotting, you can extract the $interest_over_time object of the returned query to get a data.frame that has the number of hits per year. Note that for some queries where you are comparing two keywords with a large difference in search interest, you may get some days where the value for hits is “<1”. So I convert this to 0.5 to be able to plot this. I also use the function as.Date() to plot the dates correctly.
See an example looking at “extreme skiing” which is a bit more niche than “swimming”:
search2<-gtrends(keyword = c("extreme skiing","swimming"), time= "today 12-m", geo = "CA")
time_trend2<-search2$interest_over_time %>%
  dplyr::mutate(hits=ifelse(hits=="<1",0.5,as.numeric(hits)),
                date=as.Date(date))

ggplot(time_trend2, aes(x=date, y=hits, colour=keyword)) +
  geom_line()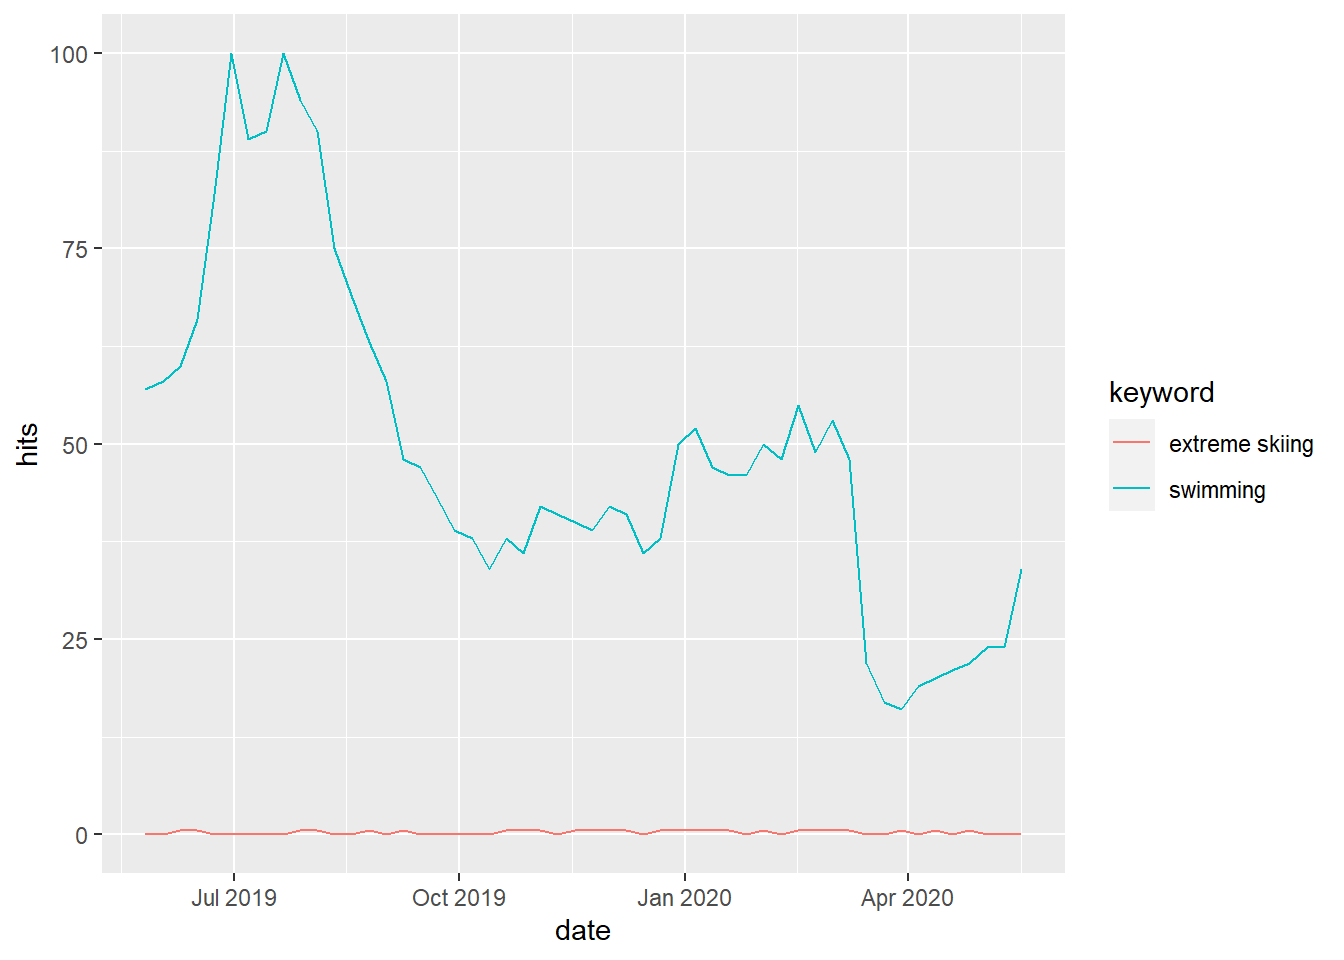
Combining keywords
From what I have read, you can’t combine keywords using gtrendsR. So for instance, “swimming OR skiing” would only return that specific keyword, and not the sum of searches of “skiing” and “swimming”:
search3<-gtrends(c("skiing OR swimming","skiing","swimming"), time= "today 12-m", geo = "CA")

time_trend3<-search3$interest_over_time %>%
  dplyr::mutate(hits=ifelse(hits=="<1",0.5,as.numeric(hits)),
                date=as.Date(date))

head(time_trend3)
## date hits keyword geo time gprop category
## 1 2019-05-26 0 skiing OR swimming CA today 12-m web 0
## 2 2019-06-02 0 skiing OR swimming CA today 12-m web 0
## 3 2019-06-09 0 skiing OR swimming CA today 12-m web 0
## 4 2019-06-16 0 skiing OR swimming CA today 12-m web 0
## 5 2019-06-23 0 skiing OR swimming CA today 12-m web 0
## 6 2019-06-30 0 skiing OR swimming CA today 12-m web 0ggplot(time_trend3, aes(x=date, y=hits, colour=keyword)) +
geom_line()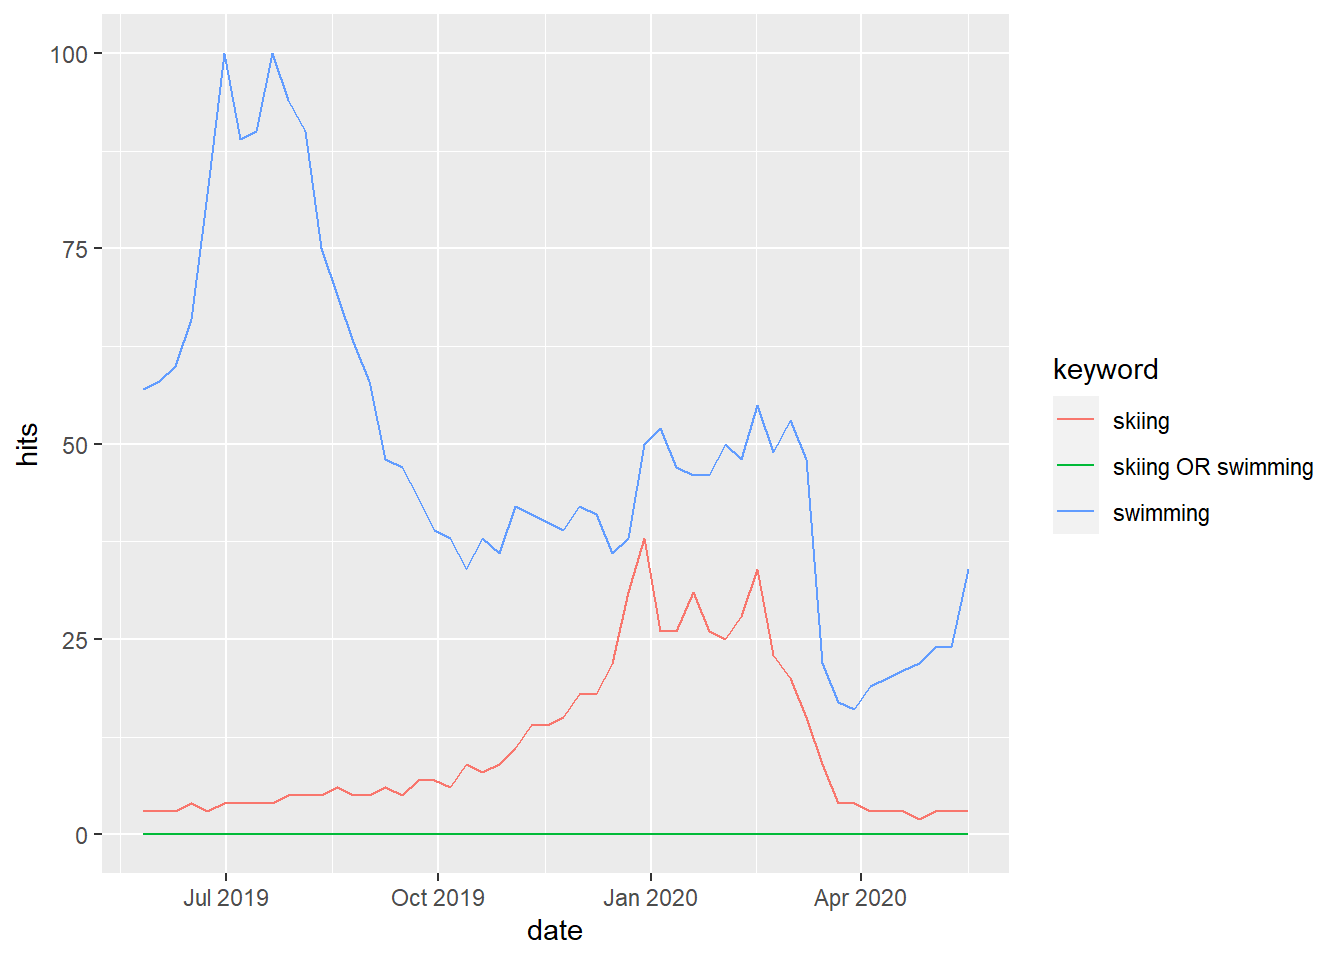
Adding vertical lines
You may often want to add a vertical line to give some context to the plot. For instance, the start of summer (June 21) and winter (December 21st) might be good dates to mark.
search4<-gtrends(c("skiing OR swimming","skiing","swimming"), time= "today 12-m", geo = "CA")

time_trend4<-search4$interest_over_time %>%
  dplyr::mutate(hits=ifelse(hits=="<1",0.5,as.numeric(hits)),
                date=as.Date(date))


ggplot(time_trend4, aes(x=date, y=hits, colour=keyword)) +
  geom_line() +
  geom_vline(xintercept=as.Date("2019-06-21")) +
geom_vline(xintercept=as.Date("2019-12-21")) 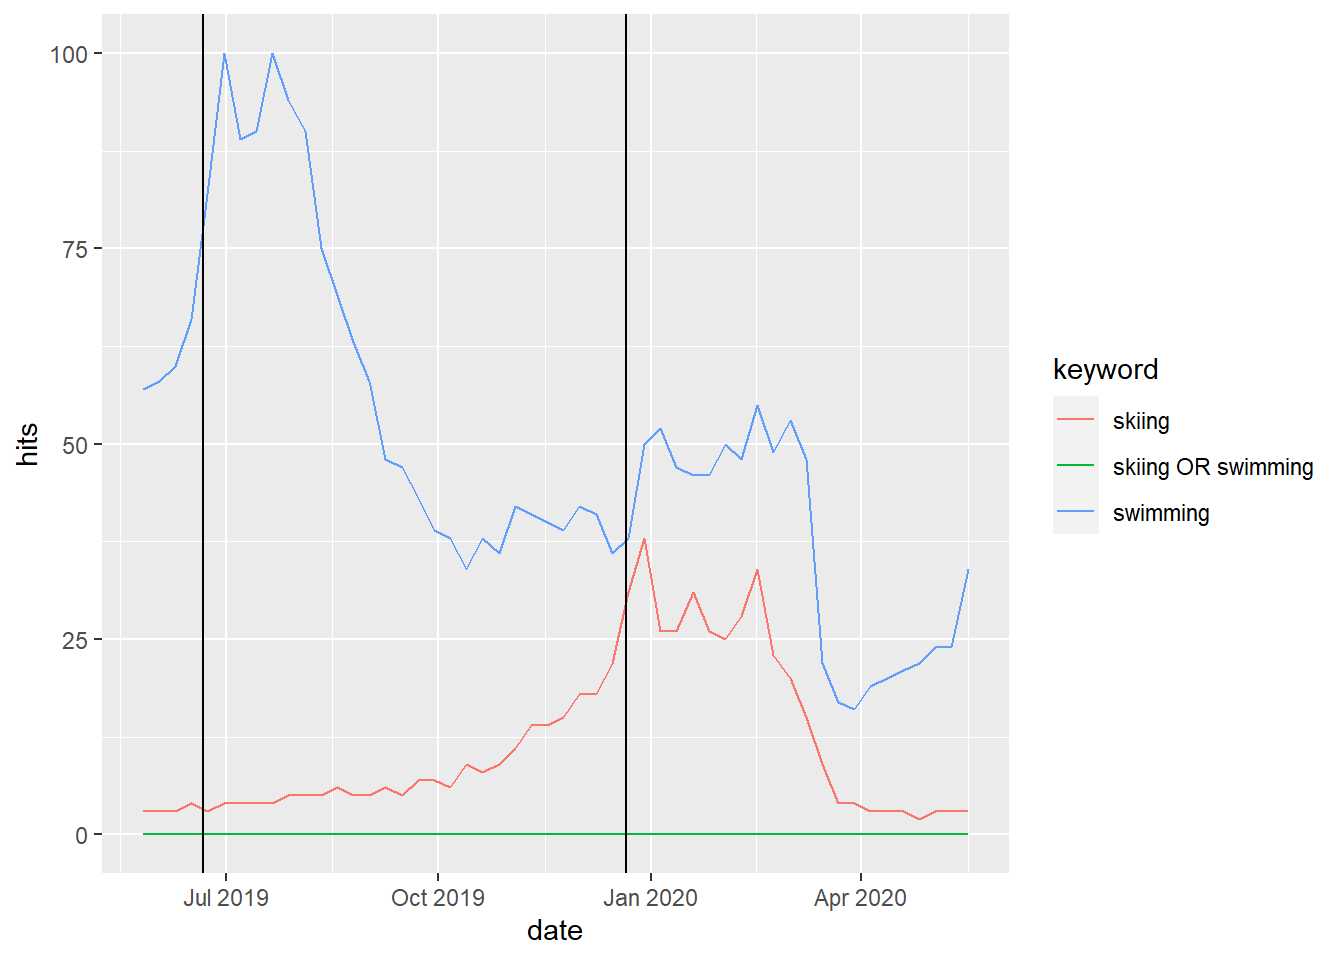
Smoothing
When you are more interested in the long term trends, you can use ggplot2::geom_smooth() to hide some of the short term variation.
search5<-gtrends(c("skiing","swimming"), time= "today 12-m", geo = "CA")

time_trend5<-search5$interest_over_time %>%
  dplyr::mutate(hits=ifelse(hits=="<1",0.5,as.numeric(hits)),
                date=as.Date(date))

plot_nosmooth<-ggplot(time_trend4, aes(x=date, y=hits, colour=keyword)) +
  geom_line() +
  labs(title="No Smoothing") +
  theme(legend.position = "none")

plot_smooth_20<-ggplot(time_trend4, aes(x=date, y=hits, colour=keyword)) +
    geom_smooth(method="loess",span=0.2, se=FALSE) +
  labs(title="smoothing factor = 0.2")+
  theme(legend.position = "none")


plot_smooth_40<-ggplot(time_trend4, aes(x=date, y=hits, colour=keyword)) +
    geom_smooth(method="loess",span=0.4, se=FALSE) +
  labs(title="smoothing factor = 0.4")+
  theme(legend.position = "none")


plot_smooth_60<-ggplot(time_trend4, aes(x=date, y=hits, colour=keyword)) +
    geom_smooth(method="loess",span=0.6, se=FALSE) +
  labs(title="smoothing factor = 0.6")+
  theme(legend.position = "none")


(plot_nosmooth + plot_smooth_20) / (plot_smooth_40 + plot_smooth_60) 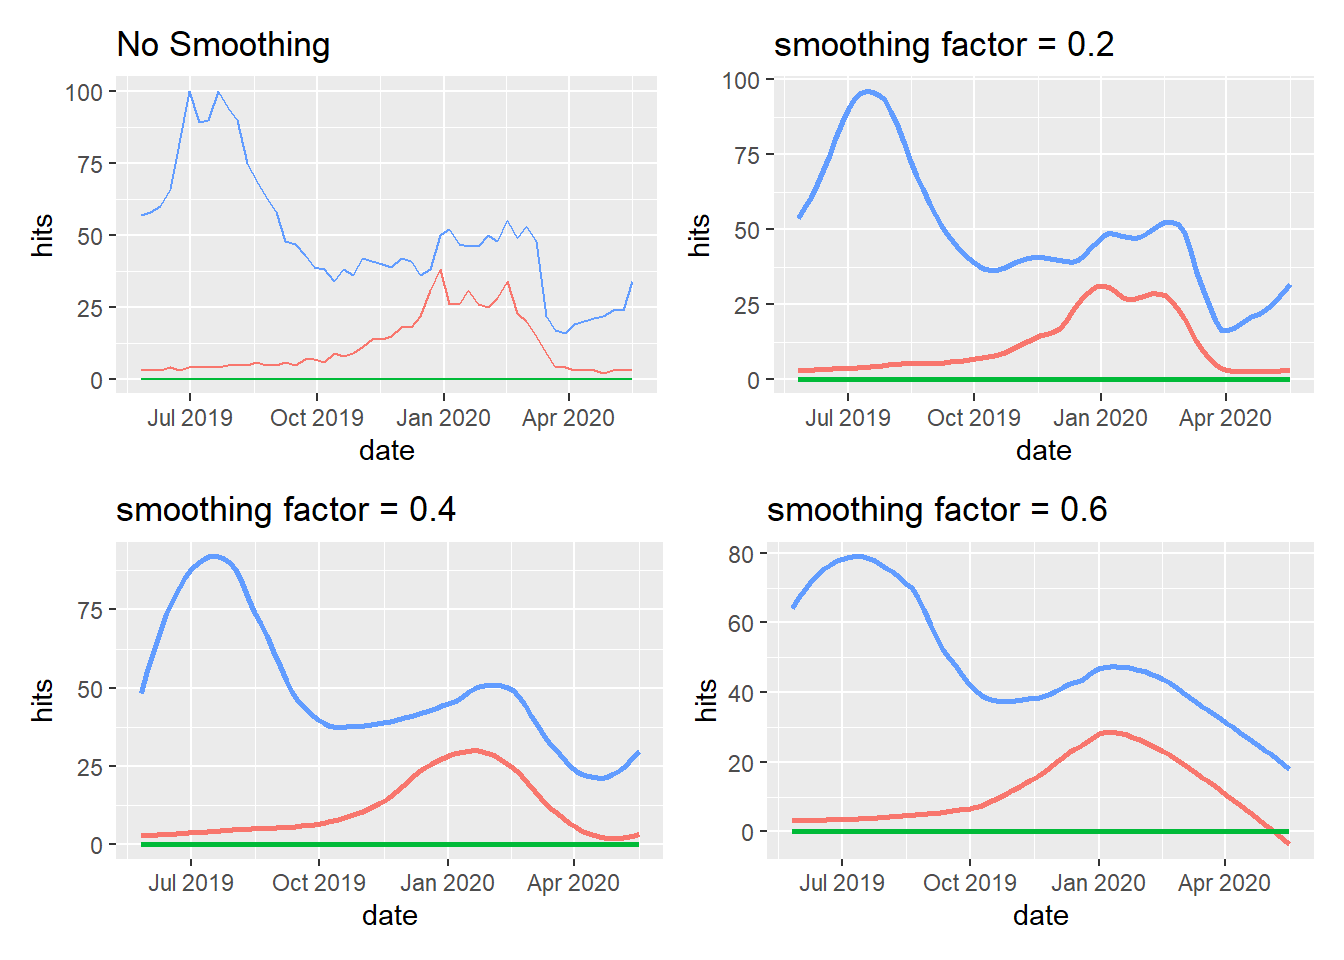
Writing a function
We can take these features and write a function to be able to quickly generate plots in the same style.
plot_trend<-function(keyword_string){
data<-gtrends(c(keyword_string), time= "2020-01-01 2020-04-05", geo = "CA")
time_trend<-data$interest_over_time %>%
  mutate(hits=ifelse(hits=="<1",0.5,hits),
         date=as.Date(date),
         keyword=factor(keyword, levels = keyword_string))
plot<-ggplot(data=time_trend, aes(x=date, y=as.numeric(hits), colour=keyword)) +
  geom_smooth(method="loess",span=0.4, se=FALSE) +
  geom_vline(xintercept = as.numeric(as.Date("2020-03-17"))) +
  theme_bw() +
  scale_y_continuous(breaks = NULL) +
  theme(legend.position = "bottom",
        legend.title = element_blank(),
        legend.text=element_text(size=10),
        axis.title.x=element_blank(),
        axis.title.y=element_blank())
return(plot)
}

plot1<-plot_trend(keyword_string = c("keyword1","keyword2"))
plot1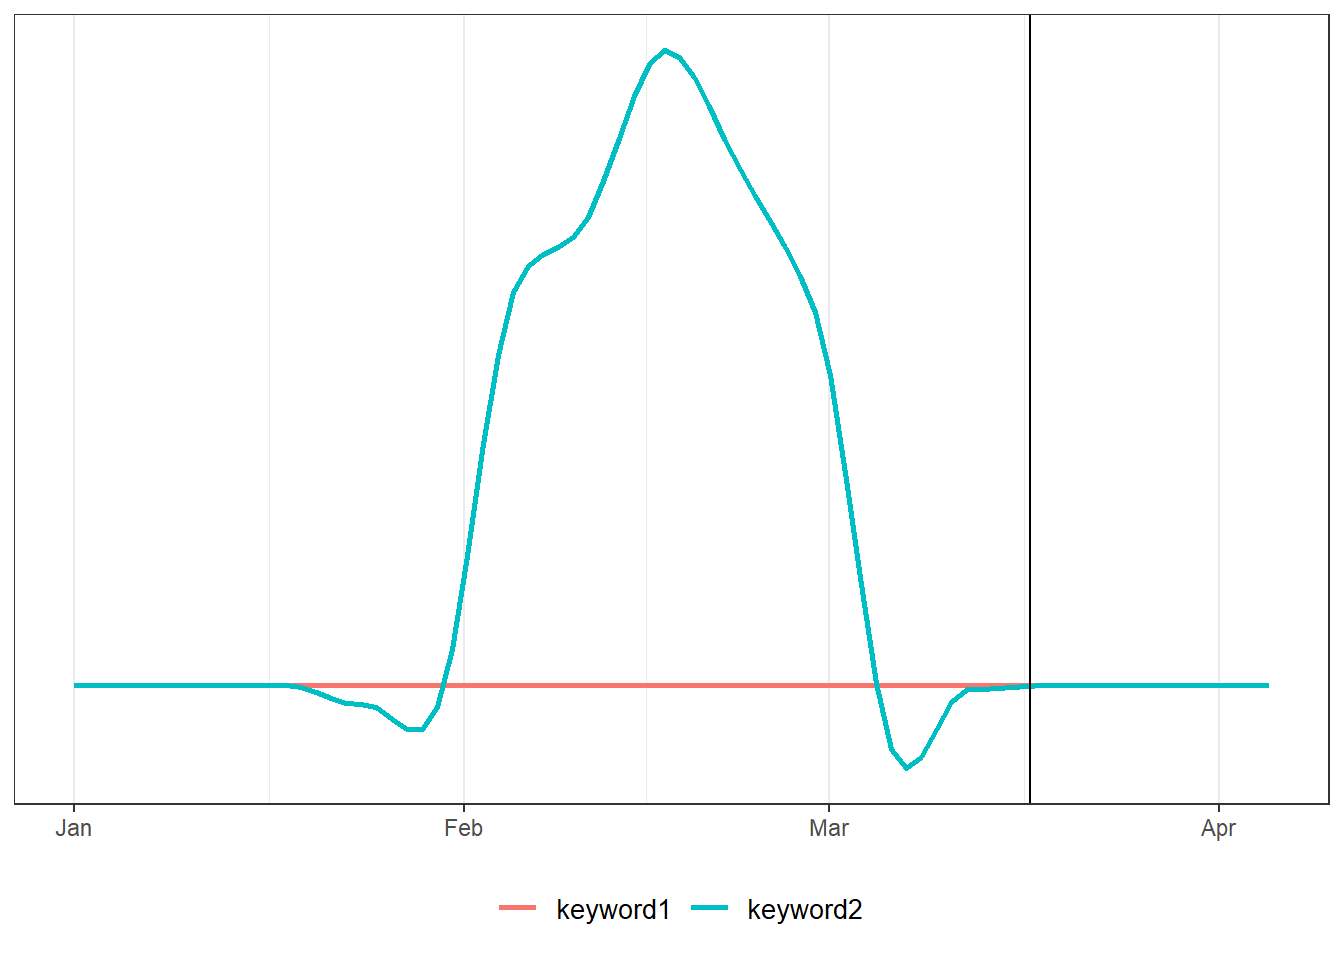
Update May 18, 2020: I had to update the package to version 1.4.6 in order to fix some errors. In the future, be sure that gtrendsR package is the latest version as the first trouble-shooting step!